Daniel sent us this one — and it builds on something we talked about before, which is how you'd use a knowledge graph to map this entire podcast archive. He says he was imagining nodes as discrete subjects, like privacy, with edges just connecting to individual episodes. But then he remembered we'd said that in a graph database like Neo4j, using only one basic relationship type misses most of the value. The real question is: for someone coming from SQL where relationships are mostly just "exists" — many-to-many, many-to-one — how do you actually define custom relationship types that surface value in graph-based retrieval, especially when embeddings are involved? And can we give concrete examples? This is exactly the kind of thing that clicks when you see it.
Right, and the mental leap he's describing is the one everybody hits. In SQL, a join table tells you two things are related. That's it. The relationship itself has no flavor. You've got a user and an order, and the relationship is "this user placed this order" — implied by the foreign key, never stated. In a graph, the relationship is a first-class citizen. You name it. You give it properties. And that changes everything about how you query.
Instead of "episode forty-two is connected to privacy" — which is the SQL-brain version — you'd say "episode forty-two explores the concept of privacy.
And that verb matters. EXPLORES is different from MENTIONS, which is different from REFUTES, which is different from BUILDS_ON. Once you've got those as distinct edge types, your queries stop being "what episodes touch on privacy" and become "what episodes argue against the privacy position taken in episode forty-two." That's a completely different retrieval paradigm.
I'm guessing the embedding side is where this gets interesting, because you're not just traversing labeled edges — you're combining structural precision with semantic fuzziness.
Yes, and that's where most of the value lives. Let me lay out the classic example that graph database people use to explain this. Imagine you're building a movie recommendation graph. In SQL, you'd have a movies table, an actors table, and a join table. You can ask "what other movies was this actor in.In Neo4j, you create an edge called ACTED_IN between an actor node and a movie node. But you also create DIRECTED, PRODUCED, WROTE. Now you can ask "find me actors who've worked with directors they later acted for in a film that also featured someone they co-starred with in a previous movie." That's a three-traversal query that's borderline unreadable in SQL but is four lines in Cypher.
Four lines and it actually finishes before the heat death of the universe.
Right, because graph traversal is constant-time relative to the depth of the relationship — it's not doing Cartesian explosions the way JOINs do. But let's bring this back to the podcast knowledge graph, because that's what the prompt is really asking about. If I were modeling this show's archive as a graph, I'd start by defining maybe six or seven relationship types. The first and most obvious is EXPLORES — an episode explores a topic. That's your basic subject indexing. But then I'd add MENTIONS for when a topic comes up tangentially. Episode seventy-four might explore battery chemistry but mention cold fusion as a side note. That distinction matters, because if someone's doing deep research on cold fusion, they don't want to wade through a battery episode just because it got name-dropped.
You're already doing something SQL can't do without a separate column for "relationship strength" that you'd have to manually populate and query with WHERE clauses.
That's the simplest case. The really powerful ones are the inter-episode relationships. I'd create BUILDS_ON — this episode directly extends an argument from a previous episode. REFUTES — this episode takes a contrary position. UPDATES — new information has come out since an earlier episode, and this one revises the conclusion. CONTEXTUALIZES — this episode provides historical or technical background that makes an earlier episode more understandable.
The REFUTES one is interesting. I can think of at least three episodes where we've walked back something we said six months earlier because new data came out. In a flat vector search, those episodes would all cluster together because they share the same semantic territory. But the relationship between them is adversarial, not complementary. Someone who agrees with the earlier take should probably hear the later one.
That's exactly what graph RAG — retrieval-augmented generation with a graph component — solves that pure vector search doesn't. Vector search says "these documents are similar." Graph traversal says "these documents are connected in a specific, named way." When you combine them, you get retrieval that's both semantically rich and structurally precise.
Let's get concrete. Walk me through what a Neo4j schema for this podcast actually looks like. I want to see the node labels and the relationship types.
I'd define a few core node labels. First, EPISODE — every episode is a node with properties like title, publication date, duration, and a summary embedding. Then TOPIC — nodes for concepts like privacy, encryption, graph databases, sleep science, whatever. Then you might have PERSON — people we've discussed, whether they're researchers, historical figures, or companies. Then maybe ARGUMENT or CLAIM — a specific assertion made in an episode that can be supported or challenged later. And SOURCE — papers, articles, datasets we've cited.
An episode isn't just a blob. It's a hub connecting to topics, people, claims, and sources.
And the edges between them are all typed. An EPISODE EXPLORES a TOPIC. An EPISODE CITES a SOURCE. A PERSON ADVOCATES a CLAIM. An EPISODE FEATURES a PERSON — not the same as mentioning them, FEATURES means they're central to the discussion. An EPISODE CHALLENGES a CLAIM. And then, crucially, the inter-episode edges: EPISODE BUILDS_ON EPISODE, EPISODE REFUTES EPISODE, EPISODE UPDATES EPISODE.
The CLAIM node is the one that probably makes SQL brains itch. Because in a relational database, you wouldn't model a claim as an entity. It'd just be text in a row somewhere. But once you make it a node, you can attach evidence to it, attach counter-arguments, track how it's evolved across episodes.
This is where embeddings come in. Each CLAIM node gets an embedding vector. When someone asks a question, you do a vector similarity search across claims, find the closest ones, and then traverse the graph from those claim nodes to find the episodes that explore or challenge them. But here's the trick — you don't stop at one hop. You traverse from the claim to the episode, then from that episode to related episodes via BUILDS_ON or REFUTES, then to the topics those episodes explore. The graph lets you expand context along meaningful structural paths, not just semantic similarity.
The retrieval isn't "find documents like this query." It's "find the claim most similar to this query, then find everything structurally relevant to that claim, then rank by a combination of semantic similarity and graph distance.
That's the idea. And it solves a real problem with pure vector search, which is that embeddings collapse nuance. Two episodes might both talk about encryption in similar language but one is arguing for backdoors and the other is arguing against them. Vector similarity puts them side by side. The graph separates them because the REFUTES edge creates structural distance even when semantic distance is small.
Which is basically the "different flavor" problem you mentioned earlier. In SQL, a relationship is binary — it exists or it doesn't. In a graph, the relationship has a type, and the type carries semantics. You're encoding meaning into the structure itself.
And here's where I want to push back on something the graph database marketing sometimes glosses over. Defining custom relationship types is powerful, but it's also a modeling commitment. Every time you add a new edge type, you're making a decision about what counts as a distinct kind of relationship in your domain. Get it wrong and you end up with a graph that's either too coarse — everything is just RELATED_TO — or too fine, where you've got seventeen edge types that nobody consistently applies.
The taxonomy problem.
And it's the same problem that's plagued the semantic web since the early two thousands. The promise was that everyone would use shared ontologies and the web would become a machine-readable graph. The reality was that maintaining consistent relationship types across a large, evolving corpus is genuinely hard. What's the difference between EXPLORES and DISCUSSES? Between MENTIONS and REFERENCES? If your annotators don't agree, your graph gets noisy.
The advice for someone building a knowledge graph for the first time is: start with fewer edge types than you think you need, and only add a new one when there's a query you can't answer without it.
Jim Webber, who's the chief scientist at Neo4j, has this line I like — "the graph should earn its complexity." Don't model everything upfront. Start with the queries you want to run and work backward to the schema. If you can't name a specific retrieval pattern that a new edge type enables, you probably don't need it.
Which is the opposite of how SQL schema design is taught. In SQL, you normalize first and query later. The data model is supposed to be query-agnostic. In graph land, the queries drive the model.
That's the second mental leap after the first-class relationships. Graphs are optimized for traversal, not storage. You're building a structure that answers specific questions efficiently. If you're building a podcast knowledge graph, the questions might be: what episodes should I listen to if I want to understand the evolution of our thinking on privacy? What topics are most interconnected in our archive? What claims have we made that we haven't revisited in over a year?
That last one is interesting — it's a query that's almost impossible in SQL without some very creative self-joins and window functions, but in Cypher it's basically "match claims that are connected to episodes older than a year and not connected to any episodes newer than a year.
And if you've got embeddings on those claims, you can add a semantic filter: "and that are similar to this user's question." Now you're retrieving not just old claims, but old claims that are relevant to what someone's asking right now.
Let's talk about the embedding part specifically, because the prompt asks about graph-based retrieval methods that depend on embeddings. How do the two actually fit together in practice?
There are a few patterns. The simplest is what I'd call vector-first, graph-second. You do an initial vector similarity search to find the top K nodes — say, the twenty most semantically relevant episodes or claims. Then you use the graph to expand from those seed nodes. You traverse one or two hops along typed edges, collecting related nodes. Then you re-rank the combined result set. This is essentially what Microsoft's GraphRAG paper described, though they used a different approach to construct the graph.
The graph expansion step is doing something the vector search can't — it's pulling in structurally related content that might not be semantically similar to the query at all, but is still relevant because of how it's connected.
If someone asks "what's our position on end-to-end encryption," the vector search finds episodes that discuss encryption directly. But the graph expansion from those episodes might pull in an episode about Signal's protocol, which might not use the phrase "end-to-end encryption" prominently but is deeply relevant. Or it might pull in an episode about a related legal case that we discussed in the context of encryption policy.
The REFUTES edge you mentioned earlier — that's the one that prevents the system from confidently presenting contradictory information as if it's consistent.
Without typed edges, a retrieval system might pull in two episodes that are semantically similar but take opposite positions, and just present both as relevant. With REFUTES edges, the system can say "here's our current position, and here's an earlier episode that argues for the opposite — be aware that we later changed our minds." That's a much richer retrieval result.
There's another pattern too, right? Graph-first, vector-second.
Yes, and that's useful when the query is more structural than semantic. "Show me all the episodes that built on episode twelve." That's a pure graph traversal — you start at episode twelve, follow BUILDS_ON edges outward, and you're done. No embeddings needed. But then you might want to rank those results by how semantically similar each one is to a particular aspect of episode twelve. So you embed the query, embed each candidate episode's summary, and sort by similarity. The graph does the filtering, the embeddings do the ranking.
The hybrid approach is where this is all heading, and it's worth naming that most of the production systems I've seen aren't pure graph-native. They're graph-augmented vector stores.
That's fair. And that's partly because the vector database ecosystem has matured faster — Pinecone, Weaviate, Milvus, they're all production-ready and have huge adoption. The graph database world has been around longer but the graph-plus-vector hybrid is still relatively new. Neo4j added native vector support in version five, and that's been a big deal.
The industry is voting for hybrid architectures. There are structural reasons for that.
And I think for the use case the prompt is describing — a podcast knowledge graph — hybrid is absolutely the right call. You want the semantic flexibility of embeddings for the initial discovery, and the structural precision of the graph for context expansion and relationship-aware ranking.
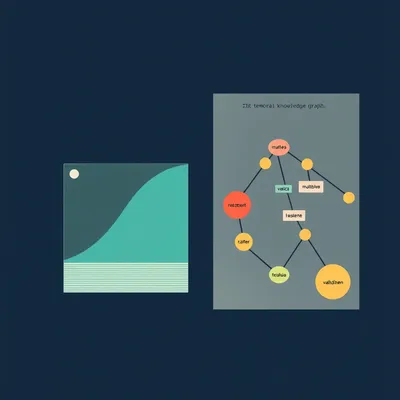
Let me throw a curveball at you. What about temporal edges? Most of the examples we've given are timeless — BUILDS_ON, REFUTES, EXPLORES. But a podcast has a timeline. Episodes have dates. Our thinking evolves. Is there value in modeling time as an explicit relationship type?
And this is something that even sophisticated graph models often miss. I'd add PRECEDES and FOLLOWS as edge types, but I'd also add something more semantically rich: EVOLVES_INTO. That's different from BUILDS_ON. BUILDS_ON means episode B directly extends the argument of episode A. EVOLVES_INTO means our position on a topic gradually shifted across multiple episodes, and you can trace the arc.
You could query for "the privacy arc" and get a path through the graph that shows how our thinking changed over time, with each edge labeled with what kind of change it represents.
And if you combine that with the CLAIM nodes, you can track individual assertions across time. "We claimed X in episode twenty, softened it in episode forty-seven, and explicitly rejected it in episode eighty-nine." That's a narrative that emerges from the graph structure.
Which is the kind of thing a podcast listener might actually want to see. "I'm bingeing your back catalog — what's the throughline on this topic?
That's where visualization becomes useful, which connects back to what the prompt was originally envisioning. A graph visualization where you can see nodes and edges is fine, but a visualization where the edges have different colors and labels based on their type — where you can see a red REFUTES edge versus a green BUILDS_ON edge — that's actually informative. It tells you something at a glance that a flat list of episodes never could.
Though I'll say, most graph visualizations I've seen are the data equivalent of spaghetti. Pretty for about three seconds, then completely illegible.
The "hairball" problem. It's a real issue with graph visualization, and it's why most production systems don't actually show you the raw graph. They use the graph for querying and then present results in a more conventional UI — a list, a timeline, a set of cards. The graph is the engine, not the interface.
Which is probably the right call for a podcast archive. Nobody wants to navigate a force-directed layout of two hundred episode nodes connected to five hundred topic nodes. They want to type a question and get a curated path through the archive.
And that curated path is what the combination of embeddings and typed edges enables. The embeddings find the entry point — the most relevant starting node. The typed edges guide the expansion. The result is a traversal path that has semantic coherence because of the embeddings and structural coherence because of the edge types.
If I'm building this for a real project — say, a knowledge graph of a podcast with a few hundred episodes — what's the practical starting point? Walk me through day one.
Day one, I'd define my node labels and edge types on paper. Probably five or six of each. I'd resist the urge to model everything. Then I'd create the graph in Neo4j and start with just the EPISODE and TOPIC nodes, with EXPLORES edges between them. That's your basic subject index. I'd embed every episode's transcript or summary and store the vectors on the EPISODE nodes.
That alone is already more useful than a keyword search.
With just that, you can do semantic search across episodes and filter by topic via graph traversal. "Find episodes about privacy" becomes a vector search for the query "privacy" plus a one-hop traversal from the TOPIC node for privacy to all connected episodes. The combination is more precise than either alone.
Then you layer in the inter-episode edges.
Once the basic structure is there, I'd start adding BUILDS_ON, REFUTES, and UPDATES edges between episodes. This is the part that doesn't scale automatically — someone has to actually listen to the episodes and annotate these relationships. But you don't need to do all of them. Even a sparse set of inter-episode edges dramatically improves retrieval quality, because they create bridges between otherwise disconnected clusters.
The annotation problem is where embeddings might actually help. If two episodes have very similar embeddings and are temporally close, there's a higher probability that one builds on the other. You could use that to suggest candidate edges to a human annotator.
It's the same idea as using embeddings to bootstrap a graph rather than building it entirely by hand. You run a similarity search across all episode pairs, filter by temporal proximity, and surface the top candidates for human review. "These two episodes are semantically similar and were released two weeks apart — does one build on the other?
Which is basically using the dumb vector similarity to make the smart graph construction cheaper.
And that's a pattern that shows up everywhere in this space. The embeddings do the heavy lifting for discovery, the graph adds precision and explainability. Neither one is sufficient alone.
To bring this back to the prompt's core question — the mental leap from SQL to graph isn't just "relationships are typed." It's that the types encode meaning that your retrieval system can reason about. A BUILDS_ON edge tells the system "this content extends that content." A REFUTES edge says "these are in tension." An EVOLVES_INTO edge says "this is a temporal arc." And when you combine that structural meaning with the semantic similarity from embeddings, you get retrieval that understands not just what content is about, but how it relates to other content.
That's a really clean summary. And I'd add one more thing: the types are yours to define. That's both the power and the responsibility. In SQL, the relationships are constrained by the schema — you've got foreign keys and join tables and that's your vocabulary. In a graph, you invent the vocabulary. The question isn't "what relationships does the database support" — it's "what relationships matter in this domain.
For a podcast archive, the relationships that matter are things like "this episode changed our minds about that topic" or "this episode provides the background you need to understand that one." Those aren't generic database concepts. They're specific to the content.
And that's why graph databases are such a natural fit for knowledge graphs. A knowledge graph isn't just a collection of facts — it's a collection of facts plus the relationships between them, where the relationships carry as much meaning as the facts themselves.
One thing we haven't touched on is how this works with large language models directly. When you're using a graph for RAG, the LLM is the one consuming the retrieved context. Do the edge types actually help the model produce better answers?
They do, and there's some early research on this. When you provide an LLM with context that includes relationship types — "episode forty-two BUILDS_ON episode seventeen, episode eighty-nine REFUTES episode forty-two" — the model can use that structural information to organize its response. It can say things like "our position evolved from X to Y to Z" rather than just listing relevant episodes in no particular order. The edge types give the model a narrative framework.
It's not just about retrieval precision. It's about giving the generation step better raw material to work with.
And this is where I think the next few years are going. Right now, most RAG systems are vector-first with a flat document store. The retrieved context is an unordered list of chunks. As graph-augmented RAG matures, the retrieved context will be structured — here's the most relevant episode, here's what it builds on, here's what challenges it, here's the topic cluster it belongs to. The LLM gets a mini knowledge graph as context, not just a pile of text.
The pile of text approach works fine for simple Q and A. "What's our position on encryption?" — find the most relevant episode, feed it to the model, done. But for "how has our thinking on encryption evolved over two hundred episodes" — you need structure.
You need the graph. And you need the edge types to be semantically meaningful. RELATED_TO doesn't cut it.
Let me ask you a practical question. If someone's listening to this and thinking "I want to build a knowledge graph for my own content" — what's the biggest thing they're going to get wrong on their first attempt?
First, they'll over-model. They'll define thirty edge types and fifteen node labels before they've written a single query. They should start with three or four edge types and add more only when a real query demands it. Second, they'll underestimate the annotation cost. Building the graph structure from text automatically is still hard. Named entity recognition, relationship extraction, coreference resolution — these are active research problems. For a high-quality graph, you're going to need human review. Plan for it.
The "start small" advice applies to basically everything in software, but especially here, because a graph with inconsistent edge types is worse than no graph at all.
A graph with sloppy edges will confidently surface connections that aren't real, or miss connections that are. And because the graph feels authoritative — it's a visualization, it's structured, it looks like ground truth — users will trust it more than they should. The failure mode isn't just bad retrieval. It's bad retrieval that looks convincing.
The worst kind.
The worst kind.
Alright, we should probably land this. But before we do — if you were designing the edge types for this actual podcast, our podcast, what would your final list be?
For our show specifically, I'd go with seven. EXPLORES — an episode explores a topic in depth. MENTIONS — a topic comes up but isn't the focus. BUILDS_ON — this episode extends a previous one. REFUTES — this episode disagrees with a previous one. UPDATES — new information revises an earlier conclusion. FEATURES — a person or source is central to an episode. And CONTEXTUALIZES — this episode provides background that makes another episode more understandable. That's enough to answer every interesting query I can think of, and not so many that annotation becomes a nightmare.
You'd put embeddings on the episode nodes and the topic nodes.
On the CLAIM nodes, if we ever get around to modeling those. Embeddings on everything, basically. Storage is cheap. Re-embedding is expensive, but you don't do it often.
Which brings us to the production reality. This all sounds great in theory. In practice, someone has to maintain the graph, update embeddings when new episodes come out, review suggested edges, and keep the taxonomy consistent. The technical architecture is the easy part. The editorial discipline is the hard part.
A hundred percent. And that's true of basically every knowledge management system ever built. The technology works. The humans are the bottleneck.
As is tradition.
As is tradition.
Now: Hilbert's daily fun fact.
Hilbert: In the nineteen-forties, the inhabitants of the Chatham Islands developed a unique method for making butter that involved wrapping it in flax leaves and burying it in peat bogs for several months. This practice gave rise to the surname Butterworth among several families on the island, as they became known for producing what was called "bog butter" — a delicacy that was traded with passing ships for tools and fabric.
...right.
Here's what I'm left thinking. The graph database conversation often gets framed as a technology choice — SQL versus Cypher, relational versus graph-native. But the real shift is conceptual. It's about treating relationships as meaningful entities rather than structural scaffolding. And once you make that shift, you start seeing your content differently. You stop thinking about a podcast archive as a collection of episodes and start thinking about it as a web of ideas, arguments, and revisions. The retrieval is better, sure. But the real value is that you understand your own work more clearly.
That's well said. And I think that's the thing to leave listeners with. The question isn't "should I use a graph database." The question is "what relationships in my content actually matter, and am I modeling them in a way my retrieval system can use." If the answer is no, all the embeddings in the world won't save you from surface-level results.
Thanks to our producer Hilbert Flumingtop, and to everyone who's been sending in prompts. Keep them coming.
This has been My Weird Prompts. Find every episode at myweirdprompts.
We'll be back.

")